Farm Insights & Analytics
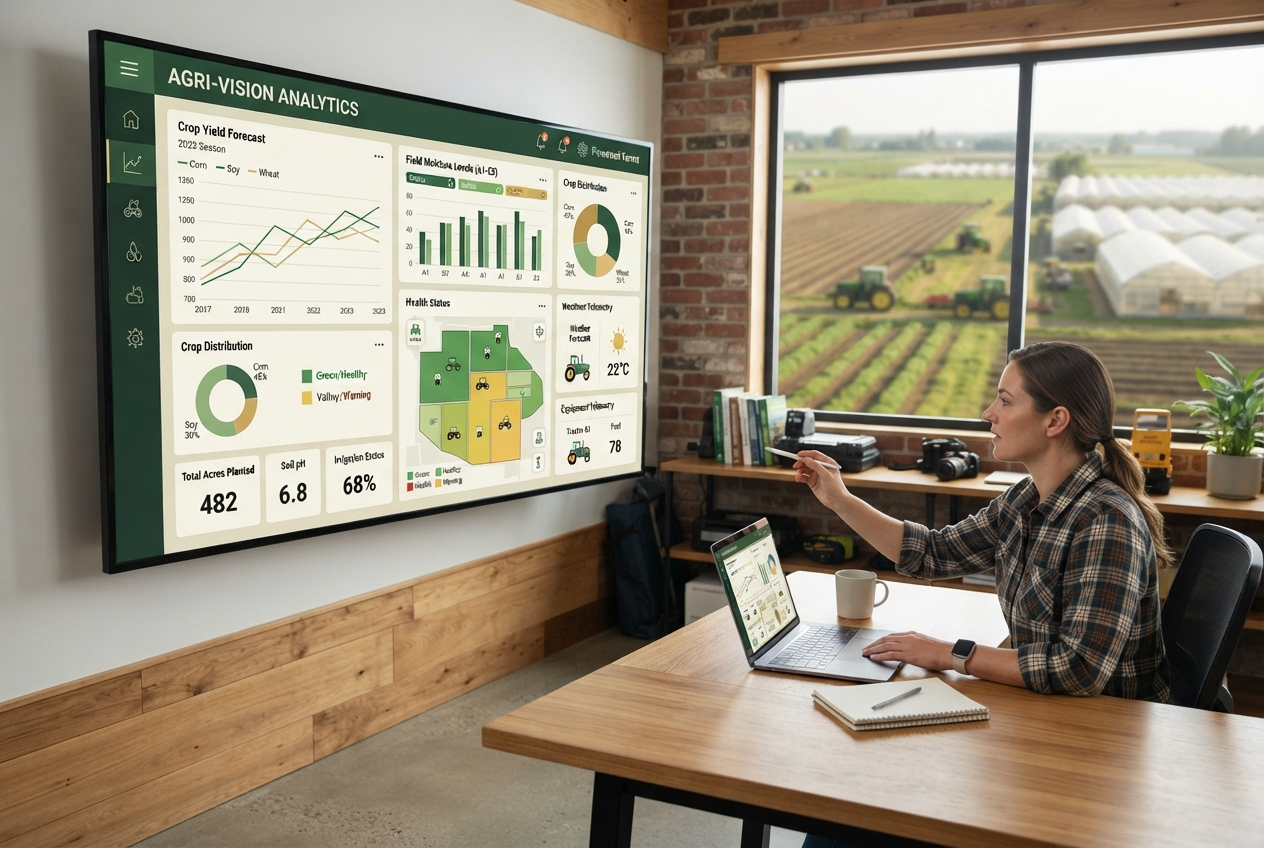
Transform raw data into clear, actionable intelligence. Our analytics platform combines weather forecasting, field mapping, and performance tracking to give you complete visibility into your farming operation.
See the Platform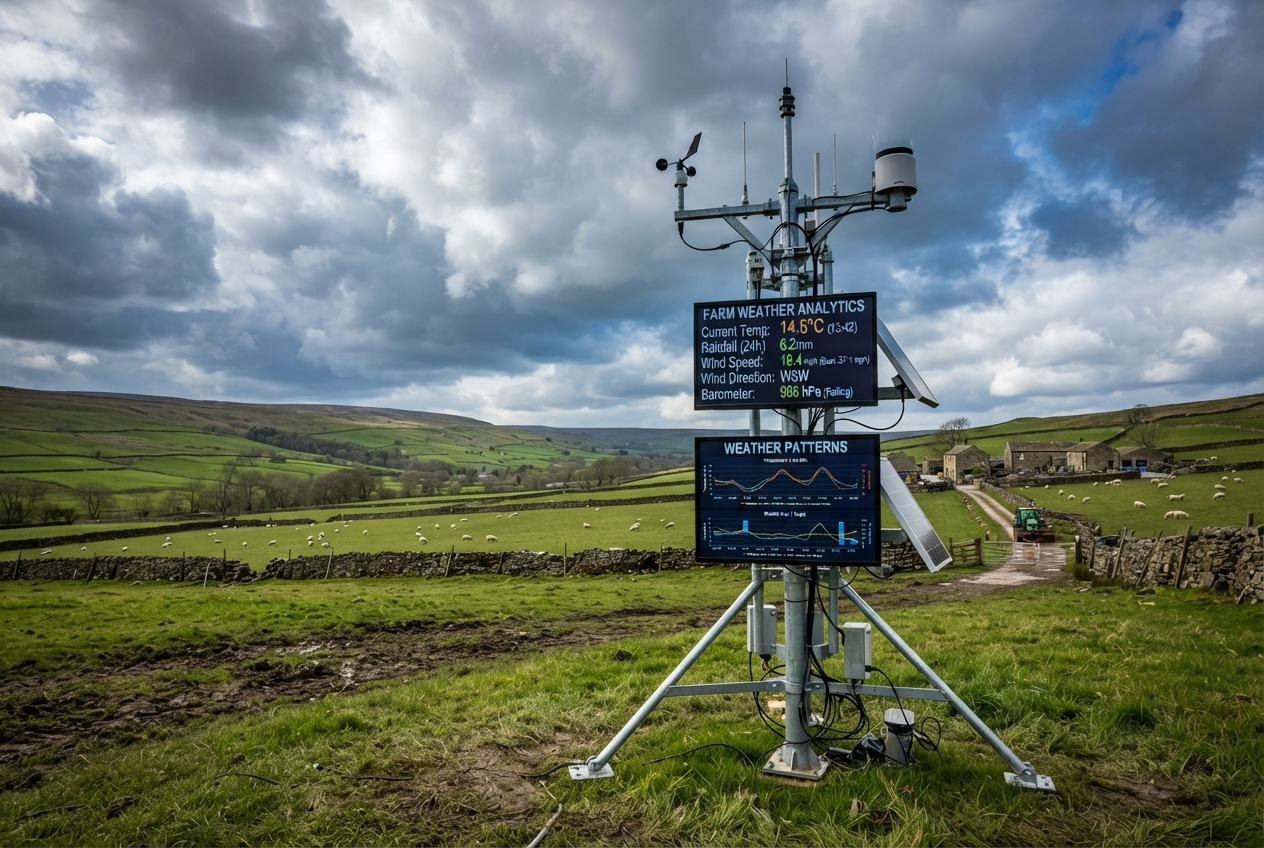
Hyperlocal Weather Intelligence
Standard weather forecasts aren't precise enough for farming decisions. AgriNova's weather analytics combine on-farm weather stations with advanced modelling to deliver field-specific forecasts and microclimate data.
- 7-day hyperlocal forecasts updated hourly
- Frost risk alerts with 48-hour advance warning
- Rainfall accumulation and soil moisture forecasting
- Spraying window recommendations
- Historical weather analysis and trend identification
Integrated Farm Management
Plan, track, and optimise every operation from a single unified platform
Field Mapping
Digital field boundaries with GPS-accurate mapping. Track crop rotations, input applications, and operations history for every field on your farm.
Task Planning
Schedule and track farming operations from planting to harvest. Assign tasks to team members and monitor progress in real-time.
Compliance Records
Automated record-keeping for regulatory compliance, organic certification, and farm assurance schemes. Export reports with one click.
Performance Tracking
Compare yields, input costs, and profitability across fields, varieties, and seasons. Identify what works best on your farm.
Input Management
Track seed, fertiliser, and crop protection product usage. Monitor stock levels and receive automatic reorder alerts.
Team Collaboration
Share data and insights with your team, agronomist, and contractors. Role-based access ensures everyone sees what they need.
Powerful Data Visualisation
Complex data becomes clear through our intuitive visualisation tools. Interactive maps, charts, and dashboards make it easy to spot patterns, identify issues, and communicate insights to your team.
- Interactive field maps with layered data overlays
- Time-series charts for tracking changes over seasons
- Customisable dashboards for different stakeholders
- Export-ready reports for board meetings and investors
Automated Reporting
Generate comprehensive reports automatically, from daily operational summaries to seasonal performance reviews
Daily Operations
Automated daily summaries of field conditions and activities
Weekly Performance
Crop progress, weather impact, and irrigation efficiency
Seasonal Reviews
Complete end-of-season analysis with year-on-year comparisons
Sustainability
Environmental impact, carbon footprint, and resource efficiency
Unlock Your Farm's Data Potential
See how AgriNova's analytics platform can transform your decision-making
Request a Platform Demo